This was the 4th Ludum Dare that I wanted to participate in, and the first where I actually did. I was inspired by my recent discovery of a GameBoy GTA game, and my unconventional weapon (theme) was a deck of cards.
It was also my first time making anything tile-based, and it worked very well for my experience at the time. Even better, it was the first time I had the capability to load and save, and the game was also the map editor for the game. Very much something I’d like to do again sometime.
UPDATE: A much better resource for frequencies of types of stars is on this wiki page for Elite: Dangerous.
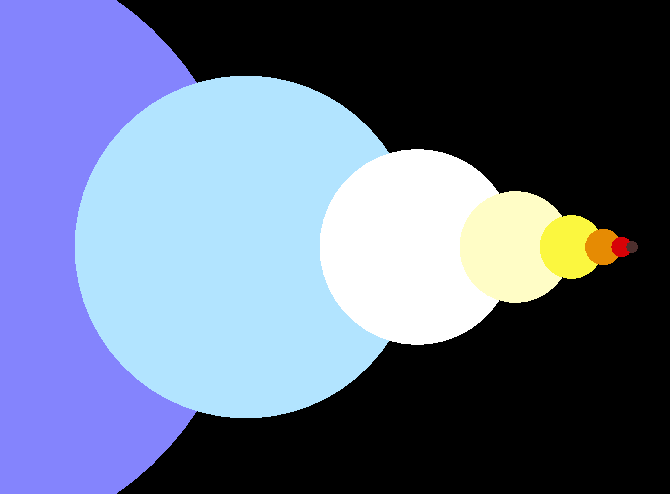
I’ve done a lot of research on stellar classification, perhaps too much. Here’s a visual representation (not at all to scale!) of stars by type from O to L.. and L is a brown dwarf, so it’s not technically a “star” per say.
Stars by type, in order: OBAFGKML
And here’s a table of those color values (in percents RGBA):
As for the frequencies (as in, percent of stars that are a specific type), they have been slightly manipulated (if I am remembering correctly) to make the rarest types a little more common, but are based on my best guesses from research:
There are two more brown dwarf / substellar mass classifications I could be using (T and Y), but I am not because they are not commonly visible.
Because L-type (and T & Y) “stars” are so hard to see, it is entirely possible they could outweigh the existence of other types, but we just can’t see them!
Suddenly it was time. I didn’t plan or prepare, I hadn’t coded in a little while. I decided the jam would jolt me back into coding, I also livestreamed most of my development to force me to keep working at it.
The Story
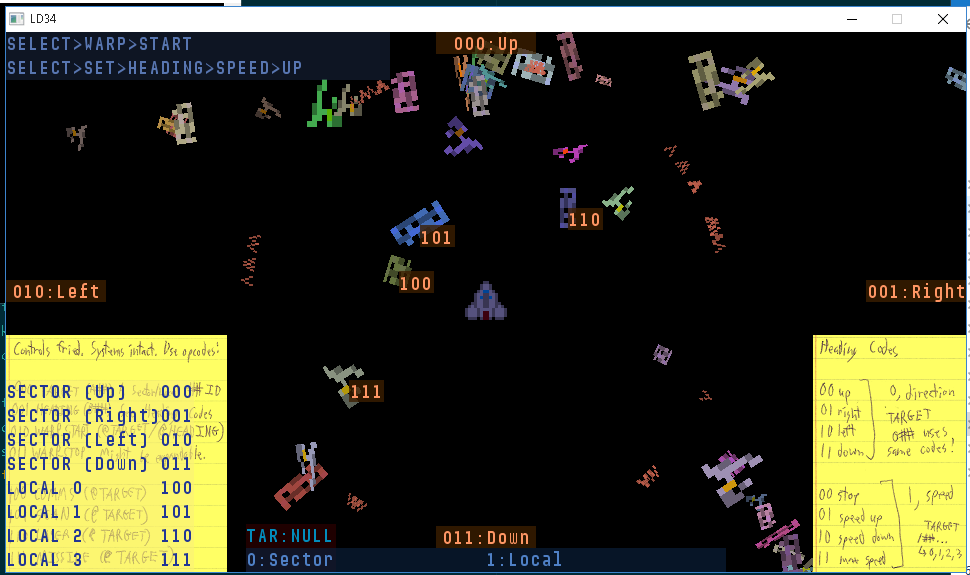
The first evening and morning worked great (Ludum Dare starts at 6pm in my timezone). A few hours on the idea, several more designing the controls (in retrospect, I spent too much time deciding on the structure of the opcodes). At some point, I hand-drew graphics, but threw them out because I could not get my scanner working.
I built the graphics for a few things, started placing them in-game, and decided I needed to rewrite everything. I quit streaming, took a laptop out to a Starbucks, and spent a few hours doing just that. It was a good break, good exercise (cycling a few miles), but wasted a lot of time.
The 2nd evening involved more streaming, things moving and generating.. Now for the game part, the 2nd morning, I didn’t stream because I was fully in crunch-time-mode over the last few hours. I focused on a communications system (which was broken, badly coded, and led to me releasing a game-crashing bug).
The Result
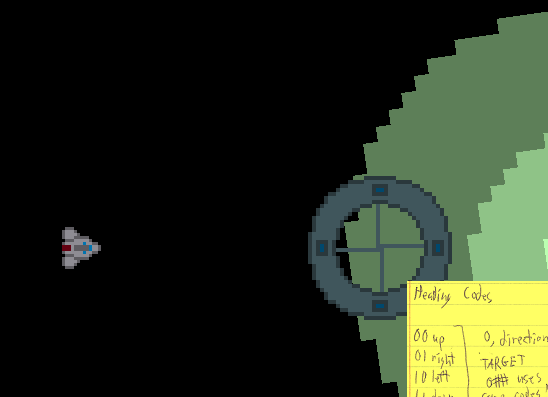
I decided to make something with a huge scope. All my time went into working on UI components and controls. There is no game, but a few mechanics to build a game within.
Positives? I got back into coding for a bit, I got to check out a lot of others’ games because I made sure to rate a bunch of them, and I felt more on track with my life.
It did burn me out though, so much so that it took a long time to write anything about it.. and even longer to actually publish it!
I am obsessed with creating a game inspired by the likes of Elite, Space Trader, and No Man’s Sky – all about exploration, trading, mining, combat, etc, and in space. I have given up on trying to be very realistic in terms of celestial masses, sizes, and distances – it’s too much for me to handle on my own – but I still want an approximation of this.
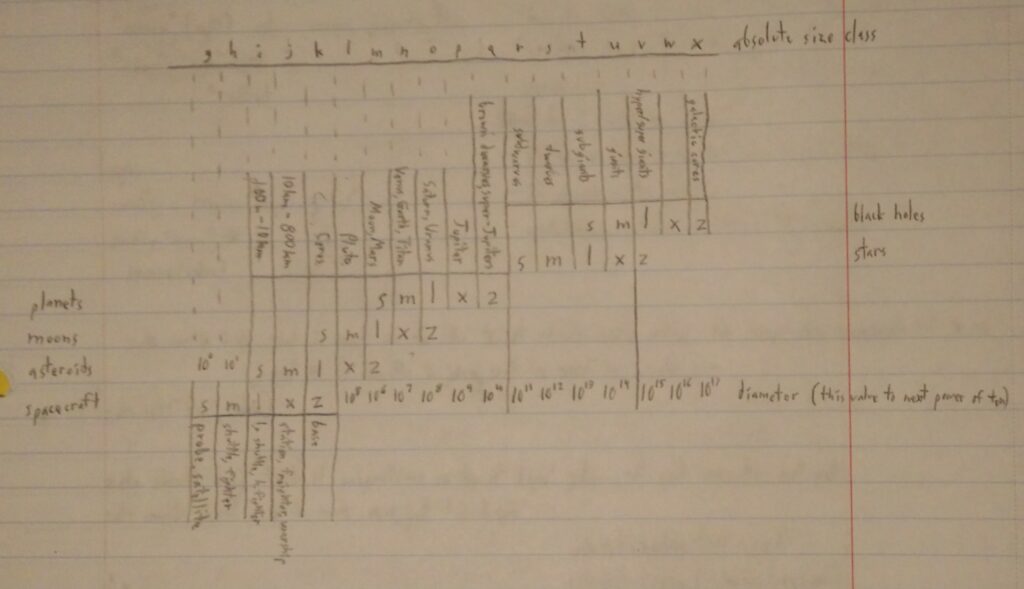
One of the problems with this is simply trying to keep track of huge numbers in mind. (Was my “average” planet 107kg or 108kg?) In an attempt to classify and simplify, I ended up creating a chart that sorts objects into 5 broad classes with 5 size-based subclasses within each.
It also conveniently solves a problem I had with trying to keep track of the relative sizes of small planets and large moons, and tiny moons compared to generation ships. There’s a lot of potential overlap between these classes of objects, which is clearly demonstrated. It’s also very nice for setting up orders of magnitude to generate mass or radius values within.
There is a lot of simplification in what I’ve done already, but there is more to be done before I even have a prototype to play with. Perhaps I’ll make a seed-based toy for generating and exploring systems from an overview as the next step.
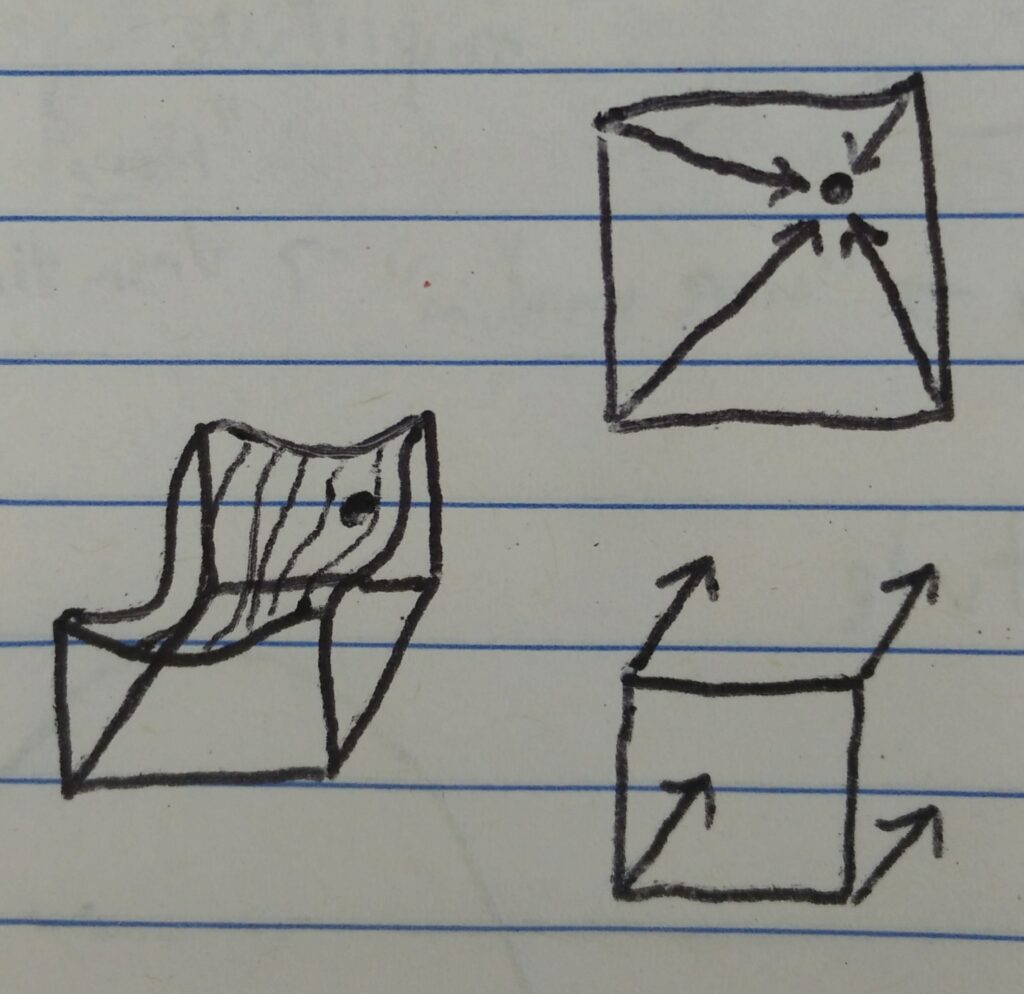
Perlin noise and simplex noise are the topics I keep coming back to, because I know they form the basis of a lot of procedurally generated content. All I knew about them to start with was give this function a value for 1 to 4 dimensions, and it will return a “random” value that is constant based on the input.
There is a somewhat ambiguous warning about passing integers “might” lead to a constant result. No, it will always be the same value at any integer. Turns out this is fundamental to how noise functions work:
One explanation I’ve read says that Perlin noise is essentially mixing dot products from 4 vectors from neighboring integers to the exact point you’ve chosen and 4 copies of a constant vector present at each of those “corners.” This is represented by the arrows in the above image.
A consequence of the constant vector at every integer value is that any integer will return the exact same value.
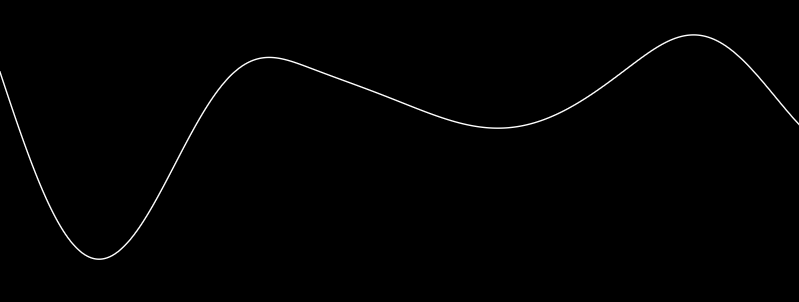
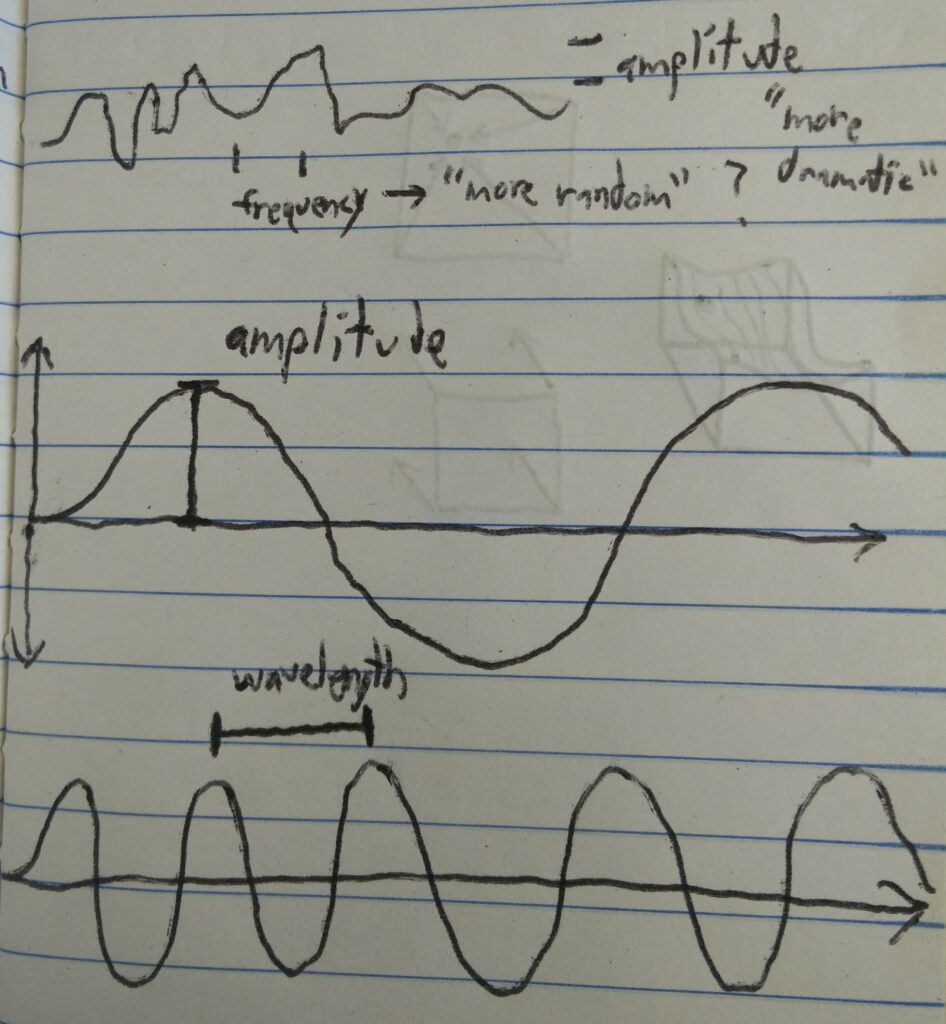
Another explanation describes a noise function as mixed sine functions of differing amplitudes and frequencies. Looking at an output from 1-dimensional noise definitely can make it appear to be that simple, but it isn’t. I mention this idea for three reasons:
It looks similar. This can help trying to visualize it.
It is periodic, you do not have an infinite domain of values to choose from without repetition.
Some terminology can still apply, such as adjusting the frequency or amplitude of noise, and depending on implementation, the range can be the same (or something easy like LÖVE‘s 0 to 1).
Noise Usage
I have been trying to use noise for quite a while, with a lot of failure, mainly around not understanding the domain and range of the noise function. As of now, these are the things I’ve learned:
Period / Domain: There is a sample of (usually) 256 values used for the constant vectors, this defines the period before the noise function starts repeating. Keep this in mind combined with other adjustments to hide or avoid this repetition. (This is how I discovered the period of LÖVE’s implementation.)
Frequency: A higher frequency can be achieved by stretching the input, leading to quicker, more dramatic transitions.
Amplitude: This one feels kind of obvious, but with LÖVE, the output is 0 to 1, so that needs to be mapped to whatever range is desired.
My apologies, but any other relevant sources at this time have been lost to the ages, with the possible exception of the source code to a demake of No Man’s Sky I have put some work into. I will revisit that at a later date.