Semi-Empirical Stellar Equations

I’ve spent a lot of time trying to answer certain questions in astronomy, where I just want a rough approximation for the purpose of a simulation, and don’t need an exact answer. These are some of the equations I’ve come up with.

Yerkes Classes’ T/Mv Relations

These equations are shown as functions where x is temperature in Kelvin, and f(x) is absolute magnitude (visual). Most are valid from 2400 K to a little bit past 30000 K, the exceptions are noted. For the hypergiants and white dwarfs, the range is within an elliptical region, of which these functions define the major axis; for all others, they are a trend line along a Yerkes classification.

  • Hypergiants (0):
    f(x) = -8.9
  • Supergiants (Ia):
    f(x) = -0.00135x3 + 0.0233x2 + 0.0187x – 7.349
  • Supergiants (Ib):
    f(x) = 0.00329x3 – 0.0962x2 + 0.829x – 7.209
  • Bright Giants (II):
    f(x) = 0.00557x3 – 0.166x2 + 1.505x – 6.816
  • Giants (III):
    f(x) = 0.0135x3 – 0.373x2 + 3.019x – 7.233
  • Subgiants (IV):
    f(x) = -0.151x2 + 2.216x – 5.128 (4450-100000 K only)
  • Dwarfs (V):
    f(x) = 0.00193x5 – 0.0615x4 + 0.742x3 – 4.257x2 + 12.439x – 12.996 (note: this one is the least accurate)
  • Subdwarfs (VI):
    f(x) = 0.131x3 – 3.275x2 + 27.576x – 71.7 (3050-6000 K only)
  • White Dwarfs (VII):
    f(x) = 0.489x + 10.01 (4450-30000 K only)

Simple Conversions

  • Absolute Magnitude (visual) → Luminosity (solar luminosities):
    Lsun = 100 * exp(-0.944 * Mv)
    Accurate between 0-10 Mv. Probably continues accuracy relatively well.
  • Main Sequence Luminosity / Mass Relation:
    Lstar / Lsun = (Mstar / Msun)3.5
    Lstar = ( 3.68 * ln(Mstar) – 0.244 )e
    (The second equation applies to all stars.)
  • Mass / Lifetime Relation:
    Tyears = ( 23.4 – 2.68 * ln(Mstar) )e
    (This applies to all stars.)

Spectral filters are used to help classify stars. Ultraviolet, Blue, Visual, Red, and Infrared. Objects are listed in different indexes:

  • UV for the hottest objects (stellar remnants, galaxies)
  • BV (the majority of stars)
  • RI for the coolest (LTY “stars” and below)

Equations I no longer recommend

Provided for completeness, in case they are found to be useful.

  • Temperature (K) → Absolute Magnitude (visual):
    Mv = 35.463 * exp(-0.000353 * T)
    Roughly accurate between 2000-50000 Kelvin. Probably doesn’t continue accuracy at hotter temperatures. Previously this was at the top of this post, now I am not sure why (perhaps the simplicity). The Yerkes’ classifications are a better system.
  • B-V index (x) → Temperature (K):
    T = -772.2x3 + 3152x2 – 6893x + 9500
    Sorta accurate between 0-2. (This equation I am least comfortable with, and don’t plan to use.)

Realistic Star Frequencies/Colors

UPDATE: A much better resource for frequencies of types of stars is on this wiki page for Elite: Dangerous.

I’ve done a lot of research on stellar classification, perhaps too much. Here’s a visual representation (not at all to scale!) of stars by type from O to L.. and L is a brown dwarf, so it’s not technically a “star” per say.

Stars by type, in order: OBAFGKML

And here’s a table of those color values (in percents RGBA):

  O: {0.521, 0.521, 0.996, 1}
  B: {0.701, 0.898, 1, 1}
  A: {1, 1, 1, 1}
  F: {1, 0.996, 0.780, 1}
  G: {0.988, 0.972, 0.250, 1}
  K: {0.905, 0.549, 0.015, 1}
  M: {0.847, 0.011, 0.031, 1}
  L: {0.302, 0.187, 0.177, 1}

As for the frequencies (as in, percent of stars that are a specific type), they have been slightly manipulated (if I am remembering correctly) to make the rarest types a little more common, but are based on my best guesses from research:

  O: 0.00003
  B: 0.13
  A: 0.6
  F: 3
  G: 7.6
  K: 12.1
  M: 76.45
  L: 0.11

A couple last notes:

  • There are two more brown dwarf / substellar mass classifications I could be using (T and Y), but I am not because they are not commonly visible.
  • Because L-type (and T & Y) “stars” are so hard to see, it is entirely possible they could outweigh the existence of other types, but we just can’t see them!

Code to create the image above is available here.

Thinking in Orders of Magnitude

I am obsessed with creating a game inspired by the likes of Elite, Space Trader, and No Man’s Sky – all about exploration, trading, mining, combat, etc, and in space. I have given up on trying to be very realistic in terms of celestial masses, sizes, and distances – it’s too much for me to handle on my own – but I still want an approximation of this.

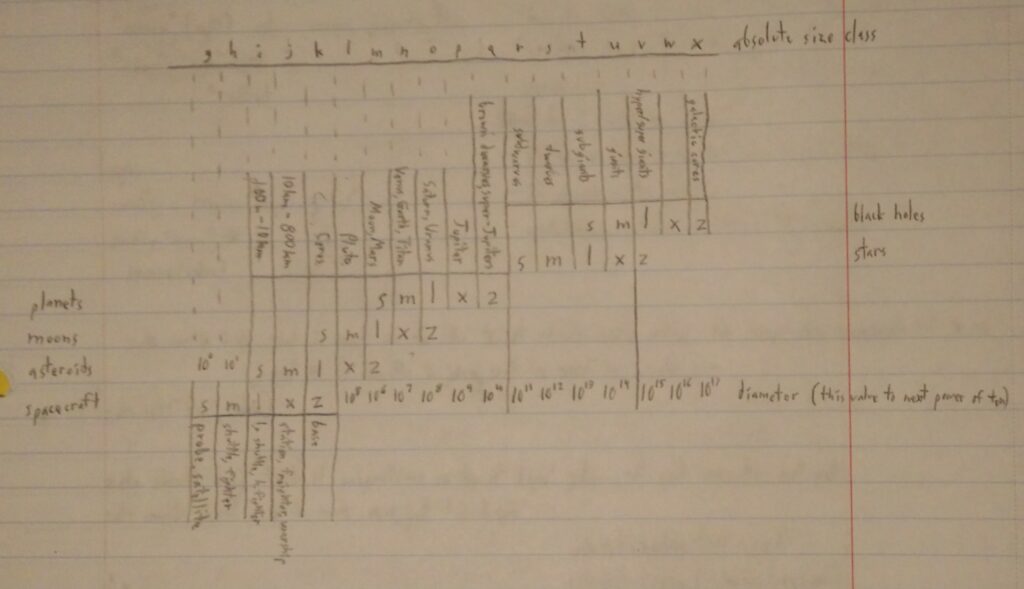
One of the problems with this is simply trying to keep track of huge numbers in mind. (Was my “average” planet 107kg or 108kg?) In an attempt to classify and simplify, I ended up creating a chart that sorts objects into 5 broad classes with 5 size-based subclasses within each.

a paper graph comparing sizes and classes of objects by orders of magnitude

It also conveniently solves a problem I had with trying to keep track of the relative sizes of small planets and large moons, and tiny moons compared to generation ships. There’s a lot of potential overlap between these classes of objects, which is clearly demonstrated. It’s also very nice for setting up orders of magnitude to generate mass or radius values within.

There is a lot of simplification in what I’ve done already, but there is more to be done before I even have a prototype to play with. Perhaps I’ll make a seed-based toy for generating and exploring systems from an overview as the next step.